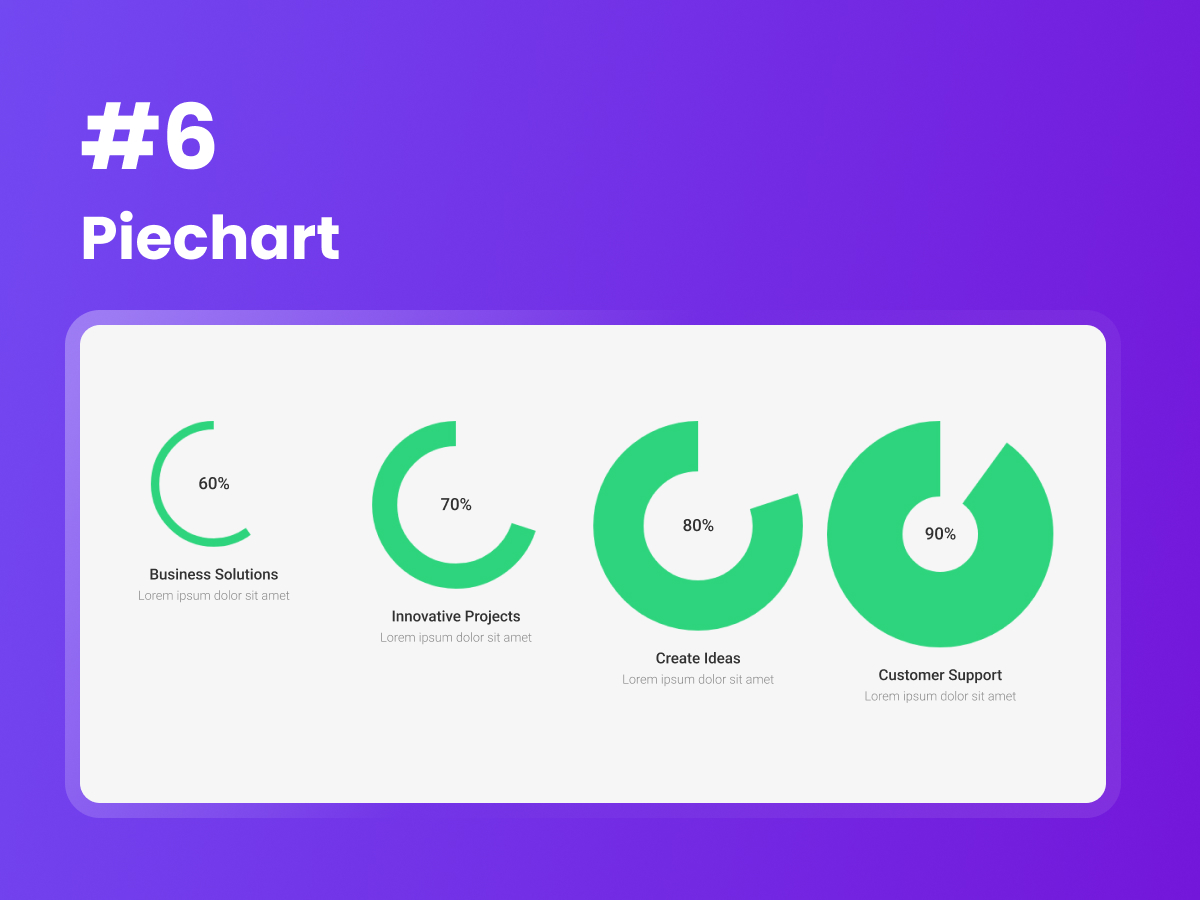
The Pie Chart block is a powerful data visualization tool that allows you to display data in a visually appealing and easy-to-understand format. With this block, you can showcase various data sets and percentages in a circular chart format, making it perfect for presenting statistics, survey results, or any other information that can be represented in a pie chart. The block offers customizable options, allowing you to choose from different color schemes, label positions, and animations to enhance the visual impact. Whether you want to highlight sales figures, compare market shares, or visualize any other data-driven insights, the Pie Chart block is the ideal solution for creating engaging and informative content. Explore our demos on this landing page to see how this block can transform your data into visually stunning representations.
Browse page to single page WDesignKitText With Side PanelThe Table of Contents block is a versatile tool that enhances readability and navigation on your website. With an intuitive interface, it automatically generates a structured list of headings, allowing users to easily explore and jump to different sections of your content.
4.7( 0 Review )
( 10 Views )( 100 Downloads )
Assets : Assets :
Assets :Live PreviewHow to Download?
DescriptionWhether you're creating long-form blog posts, documentation, tutorials, or knowledge bases, the Table of Contents block is the perfect solution for organizing and structuring your content. By providing a clear and interactive roadmap, it helps improve user engagement, accessibility, and overall reading experience.Features1. Automatic Generation: The Table of Contents block instantly scans your content and generates a structured list of headings, saving you time and effort in manual creation.1. Automatic Generation: The Table of Contents block instantly scans your content and generates a structured list of headings, saving you time and effort in manual creation.1. Automatic Generation: The Table of Contents block instantly scans your content and generates a structured list of headings, saving you time and effort in manual creation.1. Automatic Generation: The Table of Contents block instantly scans your content and generates a structured list of headings, saving you time and effort in manual creation.1. Automatic Generation: The Table of Contents block instantly scans your content and generates a structured list of headings, saving you time and effort in manual creation.1. Automatic Generation: The Table of Contents block instantly scans your content and generates a structured list of headings, saving you time and effort in manual creation.1. Automatic Generation: The Table of Contents block instantly scans your content and generates a structured list of headings, saving you time and effort in manual creation.1. Automatic Generation: The Table of Contents block instantly scans your content and generates a structured list of headings, saving you time and effort in manual creation.1. Automatic Generation: The Table of Contents block instantly scans your content and generates a structured list of headings, saving you time and effort in manual creation.1. Automatic Generation: The Table of Contents block instantly scans your content and generates a structured list of headings, saving you time and effort in manual creation.1. Automatic Generation: The Table of Contents block instantly scans your content and generates a structured list of headings, saving you time and effort in manual creation.1. Automatic Generation: The Table of Contents block instantly scans your content and generates a structured list of headings, saving you time and effort in manual creation.1. Automatic Generation: The Table of Contents block instantly scans your content and generates a structured list of headings, saving you time and effort in manual creation.1. Automatic Generation: The Table of Contents block instantly scans your content and generates a structured list of headings, saving you time and effort in manual creation.1. Automatic Generation: The Table of Contents block instantly scans your content and generates a structured list of headings, saving you time and effort in manual creation.
Upgrade to AccessUnlock all our Premium Templates & Widgets & MoreBuy Now
Premium PlanExtra 10% OFF
5 Sites10 Sites100 Sites
$39Lifetime PlanExtra 50% OFF
100 Sites
$299Version:0.0.0
Last Updated:100 years ago
View Full Version HistorySearch ID:00000
Related Tags:Related tagRelated tagRelated tagRelated tagRelated tag
Report Button
More from WDesignKit
Free
PixeSaas Template Kit
Free
PixeSaas Template Kit
Free
PixeSaas Template Kit
Free
PixeSaas Template Kit
View More


